Press Releases

Port Washington, NY, March 29, 2016 –As consumer preferences and habits for smartphone usage continue to shift, Millennials are driving the increased usage of video calling as a preferred application among smartphone users. In fact, according to The NPD Group’s Connected Intelligence Application and Convergence Report, more than half (52%) of smartphone users age 18-34 say they now use their smartphones to conduct video calls, representing an increase of 10 points year-over-year.

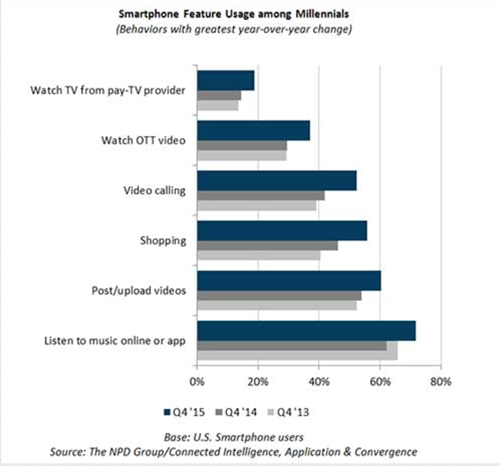
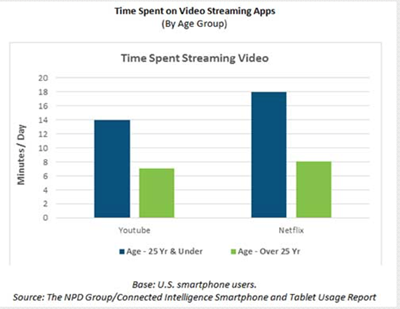
In addition to video calling, smartphone users in the 18-34 age range also cited using their device for music and shopping as well as posting and viewing videos. In fact, many of these behaviors increased in prevalence among this user segment during the prior year, too.  

 “Video calling, posting and watching video are more common among Millennial smartphone users than among any other age group,” noted John Buffone, Executive Director, Industry Analyst, Connected Intelligence. “And as smartphones increase in size, Millennials are leading increases in activity, thus also leading the migration towards larger data plans.”

Meanwhile, Millennials are using computers less often, and their behavior shifts are impacting more than just entertainment. Fewer Millennials reported using their computer for web browsing, email, shopping, Facebook, music, posting pictures or videos, navigation and Twitter. 

 The NPD Group’s Connected Intelligence Application and Convergence Report analyzes consumers’ use of the connected TV, tablet, and smartphone; examining which content resonates on which device and how these devices are drawing consumers away from their computers. The report covers use of devices that deliver content over the Internet via fixed or cellular networks, tracking usage of services such as Netflix, Facebook, and Pandora across connected TVs, video game consoles, Blu-ray Disc players, streaming media players, tablets, smartphones and computers.

Methodology:

NPD Connected Intelligence’s Application and Convergence research surveyed more than 5,000 U.S. consumers age 18 and older from diverse regions and demographical backgrounds. These consumers reported their usage of desktops/laptops, connected TVs, tablets, and smartphones. This survey was fielded in late October 2015. Trend is in reference to the Q4 2014 or Q4 2013 study fielded during the same time those years.

Press Contact

David Riley
917-543-5465
david.riley@npd.com

The NPD Group, Inc.
900 West Shore Road
Port Washington, NY 11050


Home Automation Sales Up 41 Percent Year-over-Year in 2015

 Port Washington, NY, March 22, 2016 – As the desire to create intuitive home spaces continues to increase, so too do the opportunities for devices and technologies to gain share in the smart home market. According to The NPD Group Connected Intelligence Connected Home Automation Report, nearly two-thirds (64 percent) of smart home product owners used a smartphone to control or monitor their home automation devices. Additionally, 73 percent of smart home owners already use voice commands, with 61 percent of those consumers expressing an interest in wanting to use voice to control more products in their homes.

“This reliance on smartphones to control and monitor the smart home is due, in part, to app compatibility, as nearly all home automation devices have an iPhone or Android app,” said John Buffone, executive director, Connected Intelligence. “As apps and devices become more intuitive, voice recognition – and thus, voice control – will begin to play a more prominent role in the further development of the smart home.”

In line with the momentum to automate and control the smart home, The NPD Group’s Retail Tracking Service has also recorded that Home Automation sales are up 41 percent year-over-year in 2015 versus 2014. This tracking service’s metrics incorporate not only systems controllers such as thermostats, but also the broad range of smart capabilities across technologies such as power, sensors, lighting, security/monitoring, locks, and kits.

In addition to wanting compatibility, consumers also desire convenience, evidenced by the increased usage of voice commands in the smart home market; and that number is only expected to increase as the majority of smart home product owners have indicated their desire to better integrate speech recognition technology throughout their homes. Rising to meet consumer demand is a new product set that showcases the functionality of voice command technology, such as the Amazon Echo, which leverages voice controls to turn on a Phillips Hue bulb or change the temperature settings on an Ecobee thermostat.


Methodology:
The results of The NPD Group Connected Intelligence Connected Home Automation Report are based on an online survey conducted from late October through early November 2015 to a sample of 7,168 individuals that indicated they were the head of their household. All data is reflective of the U.S. Internet homes.

Press Contact

David Riley
917-543-5465
david.riley@npd.com

The NPD Group, Inc.
900 West Shore Road
Port Washington, NY 11050

Video Content Consumption Driven by Younger Consumers

Port Washington, NY, March 21, 2016 – Eighty-one percent of all U.S. smartphone users now stream video on their devices, according to recently released data from The NPD Group’s Connected Intelligence Smartphone and Tablet Usage Report. This usage is being driven primarily by users who are 25 and younger, who spend twice as much time watching video content on YouTube and Netflix mobile apps compared to users who are over the age of 25.

As a result of this uptick in video consumption, users who are 25 and younger outperform older age groups in terms of cellular and Wi-Fi data consumption levels generated by video applications. These users consume, on average, 6,2 GB of data (cellular and Wi-Fi combined) for video streaming purposes each month, versus older smartphone users who use an average of 4,9 GB of data for video streaming monthly.

And while the majority of video streaming occurs over Wi-Fi networks, smartphone users now rely on cellular data more than ever. According to the NPD Smartmeter*, an opt-in metering application that tracks live smartphone and tablet usage behavior, the average U.S. smartphone user consumes close to 3 GB of cellular data per month, with video streaming serving as the top application driving that data consumption.

NPD Connected Intelligence Mobility practice research director Brad Akyuz noted, “Users are spending more time watching videos on their smartphones than ever before, as the adoption of smartphones that boast larger displays increases. This mobile streaming behavior is further bolstered by the new offerings of wireless operators, such as T-Mobile’s Binge On and Verizon Wireless’ go90, which run on free sponsored data.”  


*The NPD Group’s Connected Intelligence SmartMeter is an opt-in on metering solution that resides on consumers’ smartphones and tablets.


Press Contact

David Riley
917-543-5465
david.riley@npd.com

The NPD Group, Inc.
900 West Shore Road
Port Washington, NY 11050


As Streaming Video Content Surges, U.S. Connected TV Household Penetration Increases 14% Year-Over-Year

Port Washington, NY, March 7, 2016 – More than half (52%) of all U.S. Internet homes have at least one TV connected to the Internet, representing an increase of six million homes over the past year, according to The NPD Group Connected Intelligence Connected Home Entertainment Report.

While the types of devices being used to connect these televisions to the Internet are varied (video game consoles, streaming media players, Blu-ray disc players, and the TVs themselves), the average connected TV home had nearly three (2.9) devices installed that they could use for programming from apps on their televisions.

These numbers are in lock-step with the macro-level rise in the number of connected devices* Americans own. In examining the entire connected device landscape, there are now 734 million in use within U.S. Internet homes, averaging 7.8 connected devices per home. This represents an increase of 64 million installed and Internet-connected devices over the past year. This momentum is, in part, being driven by the increased adoption of Internet-enabled televisions and streaming media players as well as the increased availability of streaming video content.

“Ownership of connected televisions and streaming media players is accelerating while the availability of streaming content is simultaneously expanding. These combined forces will continue to drive increased adoption of connected devices within U.S. households,” stated John Buffone, executive director, Connected Intelligence. “At the same time, as the number of households that have access to apps on TVs rises, so too do the business opportunities for content owners and distributors.”

Methodology:

More than 5,000 U.S. consumers, ages 18 and older, were surveyed during Q4 2015. Connected TV, streaming media player, and tablet ownership survey results were calibrated to life-to-date unit sales from the NPD Retail Tracking Service.

*Total connected devices include laptops, desktops, smartphones, tablets, connected TVs, video game consoles, Blu-ray disc players, streaming media players, and iPod Touch. The number of installed and Internet-connected devices includes those that deliver broadband applications and must actually be connected to the Internet.

About The NPD Group, Inc.

The NPD Group provides market information and business solutions that drive better decision-making and better results. The world’s leading brands rely on us to help them get the right products in the right places for the right people. Practice areas include apparel, appliances, automotive, beauty, consumer electronics, diamonds, e-commerce, entertainment, fashion accessories, food consumption, foodservice, footwear, home, mobile, office supplies, retail, sports, technology, toys, video games, and watches / jewelry. For more information, visit npd.com and npdgroupblog.com. Follow us on Twitter: @npdgroup.


Contact:

David Riley
david.riley@npd.com
(917) 543-5465

Port Washington, NY, February 1, 2016 – According to global information provider, The NPD Group, annual 2015 dollar and unit sales of connected activity trackers experienced respective growth of 110 percent and 85 percent versus 2014, despite the average selling price (ASP) increasing from $96 to $109.

“The increase in ASP speaks to these devices becoming more sophisticated, and that consumers are looking for better-quality devices, not just entry-level products,” said Ben Arnold, executive director, industry analyst for The NPD Group. “This, combined with unit growth, shows that prices aren’t falling to drive demand; demand is increasing along with rising prices.”

Fitbit remained the leading brand in connected activity trackers in 2015, accounting for 79 percent of sales; the company has been the market leader in connected activity trackers since 2014, growing market share by more than 20 points since that time despite the entrance of new competing products in the wearables category.

“A confluence of factors has contributed to the growth of connected fitness trackers. Greater awareness of the products is leading to increased interest, new colors and designs have made trackers more appealing, and there are more opportunities to buy the products due to increased distribution,” said Arnold. “The dedicated fitness tracker market will continue to thrive as the products evolve and cover a wider range of users’ fitness needs.”

The Smartwatch Impact
While the smartwatch category continued to gain in popularity due to the Apple Watch launch in April 2015, overall ownership growth has continued to trail the more mainstream fitness tracker category. According to the latest NPD Connected Intelligence forecast numbers, fitness tracker ownership in the U.S. market stood at nearly 33 million devices at the end of Q4 2015, while smartwatch ownership—including more traditional watches with smartphone notification capabilities—stood at almost 13 million.

However, according to the NPD Connected Intelligence Consumers and Wearables survey, awareness of the smartwatch device category is currently even higher than fitness trackers, at 83 percent compared to 75 percent, respectively, which bodes well for future growth once newer second-generation smartwatches with dedicated cellular connectivity and a larger number of traditional watches with notification capabilities are released during 2016. In fact, NPD predicts a significant ramp up in smartwatch ownership growth starting in the second half of 2016, with an expected overall ownership number of just over 30 million devices by the end of 2017.

“Despite slightly lower overall awareness of the fitness tracker category, fitness trackers are still showing strong sales and ownership, which shows that the category still has more headroom for growth, while strong awareness has not yet translated into more robust sales for smartwatches,” said Weston Henderek, Director of NPD Connected Intelligence.


Press Contact

David Riley
917-543-5465
david.riley@npd.com

The NPD Group, Inc.
900 West Shore Road
Port Washington, NY 11050

Growth driven primarily by connected TV and streaming media players

Port Washington, NY, November 9, 2015 – By the end of 2018, 231 million installed devices are expected to be connected to the Internet and able to deliver apps to TVs, representing 82 percent growth from 2014 to 2018, according to the Connected Home Entertainment Forecast report from global information company The NPD Group.

“The two largest drivers of growth will be the increased acceptance of connected televisions in the homes of U.S. consumers, as well as the continued adoption of streaming media players such as those offered by Google, Apple, Roku, and Amazon,” said John Buffone, Executive Director, Industry Analyst, Connected Intelligence, The NPD Group. 

Connected TVs—inclusive of Internet-capable 4K TVs—are projected to drive 37 percent of the growth during the four-year period, and streaming media players are projected to drive 33 percent of the growth during that same time period.

Rise in Over-the-Top Streaming Content Services

Netflix, YouTube, Amazon, Hulu, and HBO GO remain the top five streaming video services used on connected TVs and attached content devices.  But, a new video distribution channel is surfacing through the proliferation of streaming services from television networks that no longer require viewers to subscribe to a pay TV channel bundle.  As of July 2015, 5 percent of U.S. Internet homes subscribed to at least one of these over-the-top streaming content services, and that rate rises to 7 percent of homes with a connected TV or attached content device. Current over-the-top programming includes HBO NOW, Showtime, CBS All Access, WWE Network, Sesame Street Go, Noggin, Lifetime Movie Club, and Shudder. 

“Direct streaming subscriptions to network programming allows broadband providers an opportunity to generate revenue from services above and beyond their broadband offerings, while also further increasing the utility of connected TVs,” added Buffone. “As anticipated, we are already seeing uptake of these services by millennials at levels two times the norm. And, this trend is expected to continue as more networks make unauthenticated apps available to viewers.”

The NPD Group’s quarterly Connected Home Forecast report takes an in-depth look at the landscape of device connectivity in the United States, estimating how many connectable devices will be installed in consumers' homes and how many of those consumers will ultimately connect these devices to the Internet.

About The NPD Group, Inc.

The NPD Group provides market information and business solutions that drive better decision-making and better results. The world’s leading brands rely on us to help them get the right products in the right places for the right people. Practice areas include apparel, appliances, automotive, beauty, consumer electronics, diamonds, e-commerce, entertainment, fashion accessories, food consumption, foodservice, footwear, home, mobile, office supplies, retail, sports, technology, toys, video games, and watches / jewelry. For more information, visit npd.com and npdgroupblog.com. Follow us on Twitter: @npdgroup


Contact:
David Riley
david.riley@npd.com
(917) 543-5465


Port Washington, NY, October 28, 2015 – As consumers become more aware of the benefits and capabilities of activity trackers and smartwatches, combined with the market entrance of key players such as Apple in the smartwatch space, The NPD Group forecasts at least a 4 percent increase in ownership of wearable devices such as activity trackers and smartwatches during the Q4 2015 holiday season in the U.S. market. In the latest Consumers and Wearables report, The NPD Group tracked consumers’ intention to purchase as well as the key factors influencing their decisions on brand and functionality.

"The wearables industry has come to a crossroads in the past six months, as the quality, depth and price points of activity trackers and smartwatches have expanded at a rapid rate," said Weston Henderek, Director, Wearables, Connected Intelligence, The NPD Group. "The two sectors are much more segmented now, with the activity tracker category in particular having a wide variety of price ranges, depending on features, quality, and design."

In November 2013, awareness of activity trackers was just over 30 percent of the U.S. market, with younger consumers being the most knowledgeable. Almost two years later, the situation has changed significantly, with close to 82 percent of the U.S. base claiming awareness of activity tracking devices.

Brand preference in the activity tracker space continues to be led by Fitbit, and by a large margin. In fact, Fitbit ownership has increased 13 percentage points since February 2015, and it remains the only activity tracker brand that consumers request by name on a regular basis, rather than just by comparing features or style.

Watch out, World: The Apple Watch is Transforming the Smartwatch Sector

Whereas the price tags and continued uncertainty on the part of consumers about the functionality of smartwatches has—in the past—stalled any significant growth in the category, the release of the Apple Watch in April has made major ripples within the smartwatch sector.

“Smartwatch adoption has started to increase significantly following the launch of the Apple Watch, which is much more of a mainstream product than other generation one smartwatches,” Henderek added. “However, even the Apple Watch is not expected to reach its full potential until the launch of a second-generation version—presumably with integrated cellular connectivity. In fact, independent cellular connectivity is one of the key differentiators [compared to activity trackers] that will accelerate smartwatch growth even further in the coming year.”

Activity Trackers/Digital Fitness Devices: The Must-Have Item this Holiday Season

According to NPD’s U.S. Technology and Sports Retail Tracking Service data, retail sales of activity trackers/digital fitness devices (excluding smartwatch sales) increased 120 percent over the first eight months of the year (Jan.’15 – Aug.’15), from $343.5 million to $754.8 million.

“That level of growth is expected to extend through the end of the year, making activity trackers some of the hottest tech gifts this holiday. Awareness of these products has grown tremendously over the past year, and there are a diverse number of products on the market offering a variety of features and price points,” said Ben Arnold, Executive Director, Industry Analyst, Consumer Electronics, The NPD Group. “Manufacturers continue to partner with designers to increase the appeal of the products, and there is a product for every type of consumer—from the most active athlete to the mom who just wants to remember when to pick up her kids from soccer practice—on the market.”


Press Contact

David Riley
917-543-5465
david.riley@npd.com

The NPD Group, Inc.
900 West Shore Road
Port Washington, NY 11050

The CE industry reached a milestone in the second quarter with half of U.S. Internet homes now owning a Connected TV device.  This includes connected TVs, video game consoles, streaming media players, and Blu-ray Disc players that consumers connected to the Internet allowing them access to apps such as Netflix and Hulu. The total number of homes that have a Connected TV device is up to 46 million, a four million home increase from Q2 of last year, according to The NPD Group Connected Intelligence Connected Home Entertainment Report.

A primary driver of this growth has been the success of the SMART TV industry. According to NPD’s Retail Tracking Service, 45 percent of TVs sold in the U.S. during Q2 supported apps, up from 34 percent last year and 24 percent two years ago. As more app-ready TVs enter homes, the rate of consumers actually connecting these displays to the Internet also increased. In Q2, 69 percent of all installed Internet capable TVs were connected, up from 61 percent last year and 45 percent two years ago.

“The increase in the number of homes that use a TV with apps is the result of three very important factors,” said John Buffone, executive director, Connected Intelligence. “Sales of TVs with apps have skyrocketed, their user interfaces have improved and there has been a surge in available premium services and programming.”

As of Q2 2015, Netflix remained the most commonly used video service among homes with connected TVs, followed by YouTube, Amazon Prime/Instant Video, Hulu and HBO GO/NOW. Compared to Q2 2014, more connected TV users reported using each of these services. HBO’s commitment to an over-the-top footprint with their GO and NOW platforms resulted in them being the first TV network to reach the top five ranking, displacing Crackle.  

“We’re living in the Golden Age of TV where significant investments are being made in developing original series. This is being enabled by growth in online services such as Hulu and Amazon Video as well as industry leading TV networks benefiting from the large pay TV subscriber base and fast developing over-the-top audience that uses apps on TV. The collaboration between TV manufacturers and content providers is imperative to keeping the connected TV ecosystem growing, both through devices and content.”  

Methodology

Connected Home Entertainment Report

More than 5,000 U.S. consumers, age 18 and older were surveyed through the second quarter of 2015. The number of installed and internet connected devices includes those that deliver broadband applications and must actually be connected to the Internet.  Connected TV and streaming media player ownership survey results were calibrated to life-to-date unit sales from the NPD Retail Tracking Service.

Millennials are on the road to building smarter homes. According to The NPD Group Connected Intelligence Home Automation Advisory Service, Millennials are twice as likely as the total population to have a smart home product installed in their residence.

The array of smart home products evaluated include network connected security and monitoring devices, sensors, system controllers, smart lighting, power, and appliances. One-in-four Millennials (23 percent) already installed at least one of these products in their homes, compared to 12 percent of the total population. Millennials will continue to drive the growth in this market as four-in-ten (41 percent) of this age group are already aware of and interested in owning smart home products.

A key factor that is driving this early growth is that the smart home market is no longer just for home owners. Renters are as likely as home owners to have smart home products installed, and are three times more likely to be part of the millennial age group.  More than a third of renters are between the ages of 18-34.

“Today’s smart home products no longer require professional installation and ongoing subscriptions, many are now plug-and-play options,” said John Buffone, executive director, Connected Intelligence.  “The product mix such as smart cameras, lights, and plugs, fits the lifestyle of both home owners and renters which opens up a larger, younger and more tech-savvy consumer market.”

“The mix of home automation products and services, their ease of use, and affordability makes some form of integration a reality for the majority of U.S. consumers,” said Buffone.  “The single biggest hurdle to further adoption is educating consumers on the wide array of new smart home products and services that are rapidly becoming available.”

Methodology

The results are based on an online survey conducted in March 2015 to a sample of 5,559 individuals that indicated they were the head of their household.  All data is reflective of the U.S. Internet homes.

By the end of 2014, there were 18.3 million actively connected tablets in the U.S., a 90 percent increase from 2013, according to The NPD Group Connected Intelligence Mobile Broadband Market Share and Forecast Report.  Aggressive promotions that heavily discounted or gave away tablets, carrier subsidies, and simplified service plans helped add more than 8.7 million new cellular tablet customers last year.

Over the next couple of years, however, the growth in active cellular tablet subscriptions is expected to slow down.  According to the report, the tablet activation growth will slow down to 30 percent in 2015 and then to 10 percent in 2016, compared to the 90 percent growth in 2014. However, cellular connected tablets will still continue to be an important factor in boosting active connection base for U.S. wireless carriers.

“One of the major reasons we expect to see the cellular tablet connection growth slow down over the next couple of years is the cannibalization by larger smartphone screens,” said Brad Akyuz, Director, Connected Intelligence. “As demand for smartphones boasting a large (5.0-inch plus) screen continue to increase, the value proposition of the tablet serving as a second screen diminishes. The new growth opportunities for the carriers will be in the wearables space as cellular embedded wearable devices are poised to be widely available by the end of 2016.”

METHODOLOGY

The Mobile Broadband Market Share and Forecast Report is published quarterly and uses a mix of various proprietary sources including NPD’s consumer panel and point-of-sale data, as well as public sources such as U.S. wireless carrier financial and operational KPI data to size the U.S. mobile broadband market by device type, carrier and revenue.


Pages