Press Releases

Port Washington, NY, July 9, 2020 – The unlocked mobile phone market continues its upward trajectory with an estimated 50.1 million active unlocked smartphones running on U.S. mobile networks, an increase of eight percent[1] based on the latest findings from NPD’s Unlocked Phone Demand Report 5.0. However, despite this growth in units, tailwinds are slowing, likely due to expanding 5G networks and offerings as well as store closures occurring during the COVID-19 pandemic.

“Bolstered by aggressive promotions from carriers, the BYOD [Bring-Your-Own-Device] trend continues to rise, as we saw over 20 percent of customers switching to a new service provider bring their own unlocked smartphones with them[2],” said Brad Akyuz, Executive Director and Industry Analyst, NPD Connected Intelligence. “Yet it’s difficult to overlook the impacts on this market from forces such as COVID-19 and a growing interest in 5G adoption.” 

5G Awareness, COVID Threaten the Unlocked Mobile Market (Not in the way conspiracy theorists assert)

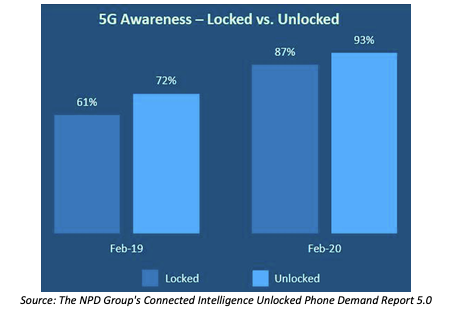
Awareness of 5G services have reached record high levels thanks to the continual marketing pushes made by carriers. Unlocked smartphone users, who generally tend to be more tech-savvy than average smartphone users, unsurprisingly over-indexed in their awareness of the 5G technology.
[1] From the end of Q1’2019 to Q1’2020

[2] February 2020

In fact, 42 percent of unlocked smartphone owners cited they would be very or extremely interested in purchasing a 5G smartphone compared to only 31 percent of locked phone owners. This eagerness could slow any momentum in the unlocked market, as non-uniform 5G network deployments make it complex to use an unlocked smartphone on any network at its full 5G potential.

Additionally, store closures as a result of the COVID-19 pandemic limited mobile phone churn activity, long known to be essential for the sales of new locked and unlocked smartphones. As carriers had to migrate to online strategies, lowered operating costs afforded them the opportunity to offer additional subsidies on locked phones. Likewise, even after physical locations began reopening, carriers that want to continue to attract smartphone buyers are offering extended financing options, making locked devices more appealing than ever.

“A number of factors are converging to make locked mobile devices more attractive to consumers who are in the market for a new or upgraded phone,” added Akyuz. “We expect cash-constrained customers in a post-COVID marketplace will either delay device upgrades or opt for cost-effective locked alternatives.” 

Methodology

The results of the NPD Group Connected Intelligence Unlocked Phone Demand Report 5.0 are based on online consumer panel research of over 1,500 U.S. unlocked smartphone owners, aged 18+ from diverse regions and demographical backgrounds. This survey was fielded in May 2020.

About Connected Intelligence

Connected Intelligence provides competitive intelligence and insight on the rapidly evolving consumer’s connected environment. The service focuses on the three core components of the connected market: the device, the broadband access that provides the connectivity and the content that drives consumer behavior. These three pillars of the connected ecosystem are analyzed through a comprehensive review of what is available, adopted, and consumed by the customer, as well as reviewing how the market will evolve over time and what the various vendors can do to best position themselves in this evolving market. For more information: http://www.connected-intelligence.com.

About The NPD Group, Inc.

NPD offers data, industry expertise, and prescriptive analytics to help our clients grow their businesses in a changing world. Over 2000 companies worldwide rely on us to help them measure, predict, and improve performance across all channels, including brick-and-mortar and e-commerce. We have offices in 27 cities worldwide, with operations spanning the Americas, Europe, and APAC. Practice areas include apparel, appliances, automotive, beauty, books, B2B technology, consumer technology, e-commerce, fashion accessories, food consumption, foodservice, footwear, home, juvenile products, media entertainment, mobile, office supplies, retail, sports, toys, travel retail, video games, and watches / jewelry. For more information, visit npd.com. Follow us on Twitter: @npdgroup.


Press Contact

Lauren Leetun

Lauren.Leetun@npd.com

407.592.7923

While smartphones were once at the center of the connected technology universe, consumers are gravitating towards an integrated ecosystem with assistant at the core.

Port Washington, NYJune 18, 2020 – As connected tech adoption continues to increase among U.S. households, operating systems (iOS, Android) and the accompanying voice assistants are becoming increasingly important to consumers, according to data from The NPD Group’s new Evolving Ecosystem report out of the Connected Intelligence practice.

“Given that 88 percent of U.S. households claim at least one smartphone, and streaming media players are in 46 percent of Internet-connected homes, the U.S. consumer is primed to expand their adoption of connected technology platforms,” stated Eddie Hold, President, Connected Intelligence, The NPD Group.

The report, which takes a deep-dive look into the fluctuations driving consumers away from a smartphone-centric ecosystem and towards a more comprehensive voice assistant-enabled ecosystem, found that nearly 30 percent of U.S. households currently have a smart speaker device in use. Of those households, the greatest increases in connected technology adoption are coming from home automation products and use cases (+152%), smart watches (+120%), smart TVs (+60%), smart gaming consoles (+60%),streaming media players (+44%), and tablets (+26%) 1.

“As consumers become more adept at integrating their devices to enable smart home technology, they are looking to make the use of that technology as easy as possible. We see this in both the ways they are using the devices as well as in their loyalty towards a vendor’s ecosystem,” added Hold. “As a result, all aspects of the ecosystem are experiencing growth, proving that once a consumer starts using their voice assistant consistently, they are becoming far more focused on making sure all of their devices work seamlessly with it.”

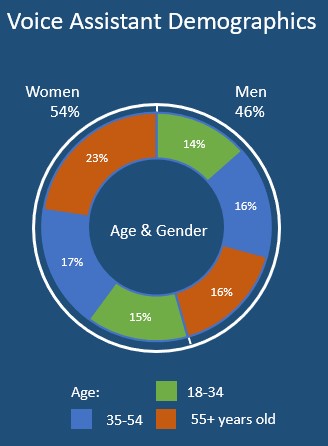
NPD’s new Evolving Ecosystem report was recently released to monitor the products, services, and hardware comprising the hub of consumers’ electronics ecosystems. Data for the report was collected between January and February 2020. Beyond the adoption of devices and the preference for varying ecosystems, the report also examined the demographics of those using the voice assistant technology more frequently, finding that a broad range of consumers are jumping onto the assistant trend. Interestingly, the report did show that consumers within higher income brackets were more likely to own voice assistants which can help to drive increased technology spends.

[1] Base: voice assistant speakers; measure: percentage increase compared to base households

About Connected Intelligence

Connected Intelligence answers the question of what consumers do once they purchase today’s latest technology, such as mobile devices. Our mandate is to operate in partnership with the core NPD sales data to tell the broader story of an entire market. The combination of Sales Data and Ownership Data is unique to The NPD Group and provides the tools that you need to truly understand the consumer today, and what they are willing to buy next. https://connected-intelligence.com

Additionally, more mobile users are taking advantage of hotspot connectivity as carriers open allowances

Port Washington, NYMay 26, 2020 – According to the latest Mobile Data Consumption Report from NPD Connected Intelligence, cellular data consumption on smartphones in March 2020 was up by 75% year-over-year and 27% month-over-month. This increase in usage was driven primarily by increased time spent on social media applications, using video conferencing platforms, and viewing content via OTT video apps.

These trends coincide with an increase in consumers’ use of the mobile hotspot tethering feature on their smartphones. According to NPD, adoption rate of mobile hotspot usage hit a record 30 percent, up 25 percent year-over-year[1].

“There’s no doubt that mobile phones have been indispensable as most Americans find themselves under shelter-at-home mandates. For many, their phones provide a connection to the outside world – a lifeline so many are yearning for,” stated Brad Akyuz, executive director, industry analyst, NPD Connected Intelligence.

“As the networks become increasingly stretched, we’re seeing more Americans utilize mobile hotspots for additional connectivity. Add into the mix that carriers have opened up more hotspot allowances, and we expect the numbers of people adopting hotspot usage on their devices to increase even more in the coming months.”

Video continues to be main driver of data consumption on smartphones, accounting for over 70% of the total data traffic (cellular and Wi-Fi combined). As people are spending more time at home, and – thus – in front of screens, NPD data from the Q1 2020 Data Consumption Report also revealed a noticeable correlation between the size of mobile phone screens and increased usage of video consumption. Users of smartphones with a screen size of 5.5-inches or larger consume 53% more data compared to those users on smartphones with screen sizes of between 4.5- and 5.5-inches.                                                                                                            

“Americans have more time to spend on their phones, trying to pass time at home or even standing in lines at grocery stores and wholesale retailers, watching engaging video content from any number of platforms that safely allows for social distancing,” added Akyuz.

Millennials report the highest interest in purchasing a 5G smartphone, reports NPD Connected Intelligence

Port Washington, NY, February 26, 2019 – According to the latest Mobile Connectivity Report from NPD Connected Intelligence, 5G awareness has reached nearly 2 out of 3 consumers, totaling 64 percent, at the end of the second half of 2018. This is up from 44 percent at the end of the first half of 2018.

Alongside increasing awareness, the report shows purchase potential is strong, as 33 percent of smartphone owners report interest in purchasing a 5G-enabled smartphone once available. Consumers on unlimited data plans, who presumably value the ability to download and stream content as needed, are more eager to purchase a 5G-enabled smartphone, at 43 percent. However, millennials report the highest potential to make the move to 5G with nearly half (49 percent) indicating interest.

“In the last several days, we’ve seen the first 5G-enabled smartphone announcements and as expected, the devices are coming with a premium price tag, due to economies of scale, and a slightly larger form factor, given the hardware needs, than what consumers have become accustom to,” said Brad Akyuz, executive director, industry analyst, NPD Connected Intelligence. “While consumer sentiment is positive, cost, form factor, and availability of 5G services will ultimately determine whether consumers will upgrade to 5G-enabled smartphones to enjoy much faster connection speeds.”


Methodology 
The results of The NPD Group Connected Intelligence Mobile Connectivity Report are based on consumer panel research that reached 3,600 U.S. cellphone users, aged 18+ from diverse regions and demographical backgrounds. This survey was completed in February 2019.

About Connected Intelligence 
Connected Intelligence provides competitive intelligence and insight on the rapidly evolving consumer’s connected environment. The service focuses on the three core components of the connected market: the device, the broadband access that provides the connectivity and the content that drives consumer behavior. These three pillars of the connected ecosystem are analyzed through a comprehensive review of what is available, adopted, and consumed by the customer, as well as reviewing how the market will evolve over time and what the various vendors can do to best position themselves in this evolving market. For more information: http://www.connected-intelligence.com.

Seventy-five-inch and larger TVs saw the highest dollar share gain in the last 12 months, according to NPD

Port Washington, NY, December 20, 2018 – Looking to purchase a bigger TV to replace your current model? You are not alone. According to the TV Ownership Trends Report from NPD Connected Intelligence, 40 percent of U.S. consumers who replaced a TV over the last two years were most motivated by a desire to purchase a bigger screen. In fact, 40 percent of replacement TVs1 purchased had a screen size of 50+ inches, with 15 percent of those made up by TV screens 60-inches and larger.

In the 12 months ending October 2018, TV sales of 55-inch and larger screens grew 6 percent and represented 63 percent of dollar sales and 32 percent of unit sales. During that timeframe, 75-inch+ TVs saw the largest dollar share gain, now making up 10 percent of dollar sales, according to NPD’s Retail Tracking Service2.

“In 2017, 39 percent of TV unit sales for the year occurred in the fourth quarter, as consumers took advantage of holiday promotions to purchase gifts or upgrade their own viewing experience,” said Stephen Baker, vice president, industry advisor for The NPD Group. “Consumers are purchasing bigger and better TV screens, especially for the primary viewing room – the living room – and we expect that trend to continue beyond the holiday season and into the New Year, as manufacturers and retailers gear up for Super Bowl sales.”

When looking at the week of Thanksgiving and Black Friday, sales of 55-inch+ TVs grew to nearly 70 percent of dollar sales and 43 percent unit sales. Driven in part by holiday promotions, 55-inch and 65-inch TVs were the top selling by units, with 65-inch TVs taking the top spot in dollar sales3.

1Replacement TVs are defined as those purchased to replace an existing household TV.

2The NPD Group, U.S. Retail Tracking Service, LCD TVs, Nov. 2017- Oct. 2018. Sales are adjusted for 5wk Jan. 2018 vs. 4wk Jan. 2017.

3The NPD Group, U.S. Weekly Retail Tracking Service, LCD TVs, Week ending November 24, 2018.

Methodology

The results of The NPD Group’s Connected Intelligence TV Ownership Trends Report are based on NPD’s quarterly Connected Home survey, which reaches 5,600 U.S. consumers, aged 18+ from diverse regions and demographical backgrounds. They report on more than 12,000 TVs installed within nearly 35,000 household rooms. This survey was completed between July 30, 2018 and August 7, 2018.

PORT WASHINGTON, N.Y., October 30, 2018 – As TV-connected devices become commonplace in U.S. homes more consumers are choosing to rent and purchase digital movies. As of August 2018, 61 million households in the U.S. had at least one internet-connected TV, video game console, Blu-ray Disc player or streaming media player, representing year over year growth of three million homes, according to The NPD Group. Specifically, households with an internet connected TV increased 20 percent and those with streaming media players grew 17 percent. At the same time, digital movie purchase and rental transactions increased 19 percent in the first half of 2018.

“Growth in digital movie transactions is being driven, in part, by access to TV-connected devices as an increasing number of viewers can simply buy and rent movies right in their living room,” said John Buffone, executive director, industry analyst, NPD Connected Intelligence. “While greater access begets consumption, certain digital movie providers facilitate ownership over renting.”

Among the top five digital movie providers, iTunes users have the highest propensity to buy over rent, because Apple’s movie consumers are more affluent and more apt to collect movies. In the 12-months ending August 2018, nearly one-quarter (24 percent) of iTunes movie transactions were motivated by a desire to build a digital collection, leading to more buying than renting, according to NPD’s VideoWatch Digital service. Vudu customers were also more ownership focused than the average video consumer, as such 20 percent of transactions were motivated by collecting. In contrast collecting movies only drove 13 percent of Amazon Video digital movie transactions, 9 percent of Google Play movie transactions, and 4 percent of Microsoft Store movie transactions.

“It’s long been known that collectability drives ownership and that’s no difference in the digital era,” Ricardo Solar, president of media entertainment for NPD. “Movie fans will always want to own great films, as such, provider agnostic services like Movies Anywhere are critical for enabling digital sales growth.”

Methodology

Information in this press release is based on the results of the NPD Connected Intelligence “Device Ownership Trends & Profile Report,” which surveyed 5,677 U.S. consumers, aged 18 and older from diverse regions and demographical backgrounds. This survey was fielded from July 30th through August 7, 2018. Trend is compared to the August 2017 survey, which fielded during a similar period last year. Additional information comes from NPD’s Videowatch Digital, which covers purchases of new and previously viewed titles, store-based and subscription-based rental, pay-per-view (PPV), video-on-demand (VOD), paid digital downloads, and free video content streaming.

Shopping is among activities shifting from computers and tablets to smartphones, according to the latest NPD Connected Intelligence report

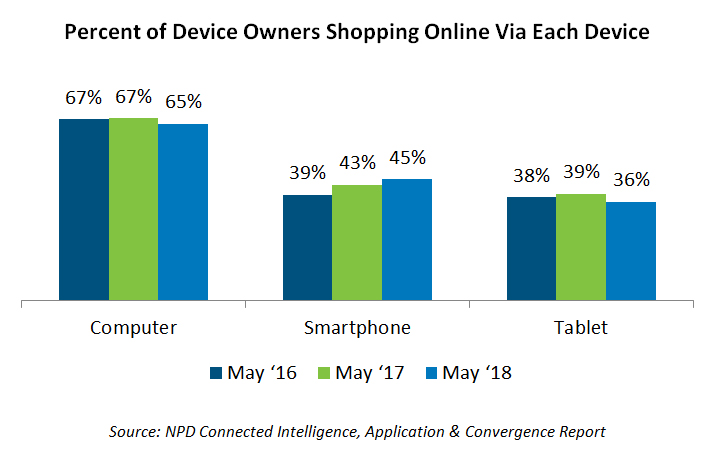
Port Washington, NY, October 15, 2018 – The role of the consumer device is evolving, as content that was once the domain of the computer continues to migrate to smartphones. While activities such as maps/navigation, email, and social media have been steadily transitioning to smartphones, shopping has seen the greatest two-year increase in smartphone usage. Over the past two years shopping gained six percentage points, with 45 percent of smartphone users now reporting they shop online via their device.

According to the latest NPD Connected Intelligence Application & Convergence report, shopping via a tablet is also beginning to decline, down three percentage points over the past year. In fact, only 36 percent of consumers report using a tablet to shop online. As may be expected, these declines are being driven in part by 18-34-year-old users.

While it is clear consumers are increasingly leveraging smartphones for online shopping, computers are still the most commonly used device. Sixty-five percent of respondents indicate they leverage a computer for some online shopping; however, that rate is declining.

“Larger smartphones are better enabling activities such as shopping and more consumers are responding by using their mobile device to make purchases,” said John Buffone, executive director, industry analyst, NPD Connected Intelligence. “The result is a base of over 100 million consumers shopping on smartphones, which is, in part, driving growth in e-commerce sales.”

According to NPD’s Checkout E-commerce data, online consumer technology sales were up 13 percent in the 12 months ending August 2018 versus the year prior, as technology shoppers made nearly one additional consumer electronics (CE) purchase online1. During that time, the percentage of the U.S. adult online buying population that made at least one CE purchase reached 45 percent buyer penetration2, with categories like cell phone accessories, portable audio, and mobile power achieving the highest purchase incidence levels.

“Overall, mobile commerce growth is being driven by an increasing number of transactions,” said Stephen Baker, vice president, industry advisor for The NPD Group. “Consumers are leveraging their smartphones to purchase ‘grab and go’ items, as these purchases can be made conveniently, without investing the time to examine product reviews or visit multiple sites for price comparisons.”

1The NPD Group, Checkout E-commerce, Sept. 2017 – Aug. 2018 vs. Sept. 2016 – Aug. 2017

2Buyer penetration is the percentage of the U.S. adult online buying population that made at least one technology purchase during the indicated timeframe.


Methodology

The results of the NPD Group Connected Intelligence Application & Convergence Report are based on consumer panel research that reached 5,420 U.S. consumers, aged 18+ from diverse regions and demographical backgrounds. They reported their usage of desktops/laptops, connected TVs, tablets, and smartphones. This survey was fielded from April 26 through May 10, 2018. Trend is compared to the May 2017 and May 2016 surveys, which fielded during a similar period those years.

Port Washington, NY, October 8, 2018 – According to the latest Unlocked Phone Demand Report from NPD Connected Intelligence, the unlocked mobile phone market is continuing to expand with an estimated 38 million consumers owning an unlocked smartphone in the U.S., accounting for 15 percent of the market. This is up from 30 million consumers one year prior (end of Q1 2017), as awareness levels reached an all-time high, 74 percent, due to exposure both in-store and online.

As is the case in the locked market, consumers purchasing unlocked devices are increasingly selecting more expensive options. The installed base of unlocked devices priced at $400 and above increased in share from 29 percent at the end of Q1 2017 to 39 percent at the end of Q1 2018. 

“The upward trajectory of the unlocked smartphone market is being driven by OEMs and retailers that see this channel as an opportunity to differentiate their offerings,” said Brad Akyuz, director, industry analyst, NPD Connected Intelligence. “Traditionally, the unlocked market provided an opportunity for OEMs pressured by Apple and Samsung’s market dominance in the carrier-controlled channels; however, these leaders are growing their share of the market as well.”

Despite increasing purchase prices, unlocked smartphone users are still electing to upgrade more quickly than their locked device counterparts. In fact, 56 percent of locked smartphone users hold onto their device for more than two years, compared to 40 percent of unlocked smartphone users. But while unlocked smartphone customers upgrade more quickly, they are slowly extending their device’s overall lifecycle, mirroring what we’ve seen in the locked market. One year ago, 26 percent of unlocked smartphones users upgraded with 12 months, but this dropped to 22 percent in Q1 2018. 

“Lengthening upgrade cycles will not slow the growth in this segment of the market,” noted Akyuz. “With carriers focusing on Bring Your Own Device (BYOD) discounts and retailers offering expanded device selections, the potential consumer base is expanding, driving further adoption.”

Methodology
The results of the NPD Group Connected Intelligence Unlocked Phone DemandReportare based on consumer panel research of over 1,500 U.S. unlocked smartphone owners, aged 18+ from diverse regions and demographical backgrounds. This survey was fielded in April 2018.

About Connected Intelligence
Connected Intelligence provides competitive intelligence and insight on the rapidly evolving consumer’s connected environment. The service focuses on the three core components of the connected market: the device, the broadband access that provides the connectivity and the content that drives consumer behavior. These three pillars of the connected ecosystem are analyzed through a comprehensive review of what is available, adopted, and consumed by the customer, as well as reviewing how the market will evolve over time and what the various vendors can do to best position themselves in this evolving market. For more information: http://www.connected-intelligence.com.

Users on limited data plans rely on Wi-Fi more than unlimited users, according to NPD Connected Intelligence

Port Washington, NY, December 27, 2017 – According to the latest NPD Group Connected Intelligence Smartphone and Tablet Usage report, cellular data usage among consumers with unlimited plans is 67 percent higher than those with limited plans. Limited plan users instead rely more on Wi-Fi access. Over the last three months, limited plan users consumed eight percent more than their unlimited plan counterparts, with a spike of 18 percent more Wi-Fi usage in October. When looking at data and Wi-Fi consumption as it relates to a user’s smartphone operating system, iOS users tend to consume more cellular data, while Android users look to Wi-Fi.

Cellular data and Wi-Fi consumption have been on the rise, as smartphone users increasingly access video content, social media apps, music and more. In fact, the average U.S. smartphone user consumes a total of 31.4 GB of data on a monthly basis (including Wi-Fi and cellular consumption). This is up 25 percent from one year prior, when the total monthly data consumption averaged 25.2 GB per user1.

“Unlimited data plans have become the de facto offering in the market and the significant variance between consumption levels of unlimited plan and limited plan users can be alarming for mobile carriers, as networks become increasingly congested,” said Brad Akyuz, director, industry analyst for NPD’s Connected Intelligence. “When users migrate from limited plans to unlimited plans, their consumption behavior shifts in favor of using cellular data more regularly. Users on unlimited plans don’t regularly seek Wi-Fi connectivity for data-hungry transactions such as video streaming, application updates, and downloads as they are not concerned about data overage fees.”

Streaming video remains the number one driver of cellular and Wi-Fi data consumption on mobile and fixed networks, accounting for 83 percent of the total data used by smartphone owners.  In Q3 2017, 67 percent of all smartphone users reported accessing video content via an app at least once a month, up from 57 percent in Q2 2017. 

1NPD Connected Intelligence Data Consumption Report, October 2017 vs. October 2016 

Methodology
The NPD Group Connected Intelligence Smartphone and Tablet Usage report provides a quarterly view of consumer smartphone and tablet behavior (Q3 2017). The report leverages an on-device and VPN-based metering solution ("Smart Meter") to provide a view of actual application and data consumption, allowing customers to view usage across a number of different metrics. This ongoing tracking was implemented between July 1, 2017 and September 30, 2017. More than 2,500 consumers with Android and iOS devices opt-in to the SmartMeter panel and are continuously tracked through an app on their devices. Of these consumers, over 50 percent share their data plan information. 

About Connected Intelligence
Connected Intelligence provides competitive intelligence and insight on the rapidly evolving consumer’s connected environment. The service focuses on the three core components of the connected market: the device, the broadband access that provides the connectivity and the content that drives consumer behavior. These three pillars of the connected ecosystem are analyzed through a comprehensive review of what is available, adopted, and consumed by the customer, as well as reviewing how the market will evolve over time and what the various vendors can do to best position themselves in this evolving market. For more information: http://www.connected-intelligence.com.


Press Contact

Megan Scott 
516-625-7516  
megan.scott@npd.com

The NPD Group, Inc. 
900 West Shore Road 
Port Washington, NY 11050

Usage of TV-connected devices is also on the rise, as more consumers stream content at home and on the go

Port Washington, NY, October 25, 2017 – According to global information provider, The NPD Group, 57 percent of all U.S. smartphone users access video content via an app at least once a month, with iOS users more likely than Android users to access video content, 66 percent versus 49 percent, respectively. Streaming video is the number one driver of cellular and Wi-Fi data consumption on mobile and fixed networks, accounting for 78 percent of the total data used by smartphone owners, with streaming video apps like YouTube and Netflix driving the greatest data demands.

YouTube is the top ranking video app for both iOS and Android users, with 45 percent of smartphone users accessing the app on a monthly basis, as stated in the latest Smartphone and Tablet Usage report from NPD’s Connected Intelligence. Netflix has the second highest usage rate with 18 percent of users launching the app monthly. Notably, iOS smartphone users are much more likely to access Netflix, with nearly a quarter of them using this app within a given month, compared to only 10 percent of Android users.

“Smartphone penetration is continuing to grow and the battle among mobile carriers to retain current subscribers, as well as grow their base is fierce,” noted Brad Akyuz, director, industry analyst for NPD’s Connected Intelligence. “Access to content is becoming a key differentiator for carriers, in addition to unlimited data plans that allow consumers to watch OTT video at home and on the go with peace of mind. As the installed base of smartphones with large displays grows, we expect mobile video data consumption will do the same.”

In addition to growing mobile video consumption, consumers are also looking to their TV-connected devices to stream content. According to the Application and Convergence report from NPD’s Connected Intelligence, consumers that use TV-connected devices to stream video grew by five percentage points versus the same timeframe a year prior (Q2 2017 vs. Q2 2016). In total, 57 million U.S. households own a TV-connected device, up from 50 million year-ago, which is driving an increase in usage across the top video streaming services.

“Through partnerships with content providers like Netflix and DIRECTV, mobile carriers are extending their reach into the consumer’s living room,” said John Buffone, executive director, industry analyst, NPD Connected Intelligence. “As mobile carriers continue to bundle access to content and remove barriers, such as data limitations, video usage both at home and on the go will continue to thrive.”

1TV-connected devices include streaming media players, video game consoles, Blu-ray Disc Players and connected TVs that are connected to the internet. 

Methodology

The NPD Group Connected Intelligence Smartphone and Tablet Usage report provides a quarterly view of consumer smartphone and tablet behavior (Q2 2017). The report leverages an on-device and VPN-based metering solution ("Smart Meter") to provide a view of actual application and data consumption, allowing customers to view usage across a number of different metrics.

The results of the NPD Group Connected Intelligence Application & Convergence report are based on consumer panel research that reached 5,355 U.S. consumers, aged 18+ from diverse regions and demographical backgrounds. They reported on their usage of desktops/laptops, connected TVs, tablets, and smartphones. This survey was fielded from April 28 through May 16, 2017. Trend is compared to the Q2 2016 survey, which fielded during a similar period last year.


Press Contact

Megan Scott 
516-625-7516  
megan.scott@npd.com

The NPD Group, Inc. 
900 West Shore Road 
Port Washington, NY 11050

Pages