Press Releases

More than one-third of smart home device owners also own a voice-activated speaker, according to The NPD Group

Port Washington, NY, October 5, 2017 – Fifteen percent of U.S. internet households currently own a home automation device, up from 10 percent in April 2016, according to global information provider, The NPD Group. Year to date, U.S. dollar sales of home automation products have increased 43 percent, with strong growth across all device types1. While security and monitoring continues to hold the largest share of dollar sales in the category, video doorbells2 (+123 percent) and smart lighting (+83 percent) are also quickly growing.
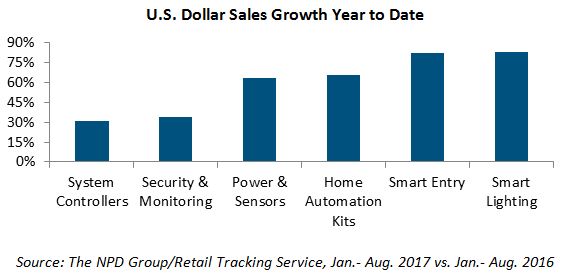
“The growth we are seeing in the number of owner homes is an indication that a broader field of available products, wider distribution, and greater awareness are actually adding users,” noted Ben Arnold executive director, industry analyst for The NPD Group. “Voice-enabled speakers have also played a key role in catalyzing interest in the smart home.”

According to the new Digital Voice Assistants: Ownership & Applications Report from NPD’s Connected Intelligence, ownership of voice-activated wireless speakers has more than tripled in a year's time, now totaling 10 percent of U.S. internet households. Of Amazon Echo and Google Home owners, 48 percent and 57 percent, respectively, reported buying their first home automation product after owning a voice-enabled speaker. In fact, 36 percent of existing smart home device owners also own a voice-activated speaker, and 65 percent of smart home device owners are interested in using voice commands to control other devices in their home.

As is often the case in emerging markets, younger consumers, aged 18-34, are the most likely to own a voice-activated wireless speaker, as well as a home automation device; but noticeable growth is also occurring in other age groups. Eleven percent of consumers aged 35-54 report owning a voice-enabled speaker, up from seven percent the prior year, while consumers 55+ grew to six percent from one percent. Similarly, 16 percent of consumers aged 35-54 report owning a home automation device, up from 11 percent the prior year, while consumers 55+ grew to eight percent from seven percent.

“The voice-enabled speaker market is expanding quickly, with a number of high-profile products expected to hit shelves in Q4 2017, and into 2018. As sales of these devices continue to grow, and more voice-enabled applications are developed, the use case for intelligent voice speakers, particularly as it relates to home automation devices, will continue to expand,” said Arnold.

1Source: The NPD Group/Retail Tracking Service, Home Automation, Jan.- Aug. 2017
2Source: The NPD Group/Retail Tracking Service, Smart Entry, Video Doorbells, Jan.- Aug. 2017 

Methodology
The results of the NPD Group Connected Intelligence Digital Voice Assistants: Ownership & Applications Report draws data from the semi-annual Connected Home Automation Survey. The survey is based on consumer panel research that reached over 5,600 U.S. consumers, aged 18+ from diverse regions and demographical backgrounds. The resulting base was over 2,600 consumers that have used voice commands to operate a consumer electronics device. They reported on their experience with digital voice assistants, ownership of voice-activated speakers, and what will drive or impede their adoption. This survey was fielded from April 7-21, 2017. Trended results are compared to a study fielded from April 11-25, 2016.


Press Contact

Megan Scott 
516-625-7516 
megan.scott@npd.com

The NPD Group, Inc. 
900 West Shore Road 
Port Washington, NY 11050
Expanding use cases, new products, and advances in operating systems refresh smartwatch excitement

Port Washington, NY, August 17, 2017 – With the introduction of new devices, new features, and updates to hardware and operating systems alike, 2017 has brought a number of changes to the smartwatch market. As of June 2017, nearly nine percent of U.S. consumers aged 18+ owned a smartwatch, up almost 1.5 percentage points from the six months prior. Additionally, according to latest WEAR Report Industry Overview and Forecast from NPD’s Connected Intelligence, growth in the category will continue, with a nearly 60 percent ownership growth expected from Q2 2017 through Q4 2018, driven in large part by anticipated new product introductions from market leaders. This forecasted growth will result in nearly 15 percent of U.S. consumers aged 18+ owning a smartwatch by 2019.

Increasing features and capabilities are key differentiators for smartwatches, which will further contribute to their growth over the forecast period. While use cases such as receiving notifications/texts, activity tracking, and news updates are still the most highly reported among smartwatch owners; use cases such as controlling music, using as a device to control pictures and video, and home automation are growing. In fact, 15 to 21 percent of smartwatch owners are already utilizing their devices for those types of activities daily.

Percentage of Smartwatch Owners that Use Each Function Daily

Source: NPD Connected Intelligence/WEAR. June, 2017.

“Rumors of the smartwatch’s demise have been greatly exaggerated and we expect to see stronger growth in the next 18 months, compared to 2016,” said Weston Henderek, director, Connected Intelligence. “Many of the early growth projections for the smartwatch were, simply put, unrealistic. But in reality, a nine percent ownership level is a pretty healthy start for the market after just a couple of years. We expect the next round of product upgrades will lead to more first-time smartwatch purchases, as well as upgrades for those with existing devices.”

Currently, smartwatch ownership is controlled by the millennial generation, which has 13 percent ownership penetration, compared to just less than nine percent for the overall market. However, as use cases broaden, shifts in smartwatch ownership will follow. In fact, the male/female split in the category is now the lowest it has ever been at 60 percent male – indicating a more mainstream audience. Additionally, despite higher pricing than activity trackers, smartwatch ownership is highest among the lowest income category (less than $45,000 per year), with 34 percent of smartwatch ownership penetration.

“While strong ownership in the lowest income category may seem counter intuitive, it is likely driven by a large number of buyers in the service industry who need a device to check incoming notifications when they can't reach for their phone,” noted Henderek. “Overall, increased features and functionality was the number one reason respondents chose a smartwatch over an activity tracker. Some of what we are seeing demonstrates a natural evolution of the device as a home control hub on the wrist, for one, and continued evolution of product capabilities will be key to winning over consumers.”

Methodology
The results of the NPD Group Connected Intelligence Wearables Survey are based on consumer panel research that reached 5,000+ U.S. consumers, aged 18+ from diverse regions and demographical backgrounds. They reported on awareness, ownership, and intent to own various wearable devices. Additionally, consumers with awareness were asked follow up details including the features and functions that they expect to see in these devices. This survey was completed in June, 2017.

About Connected Intelligence
Connected Intelligence provides competitive intelligence and insight on the rapidly evolving consumer’s connected environment. The service focuses on the three core components of the connected market: the device, the broadband access that provides the connectivity and the content that drives consumer behavior. These three pillars of the connected ecosystem are analyzed through a comprehensive review of what is available, adopted, and consumed by the customer, as well as reviewing how the market will evolve over time and what the various vendors can do to best position themselves in this evolving market. For more information: http://www.connected-intelligence.com.


Press Contact

Megan Scott 
516-625-7516  
megan.scott@npd.com

The NPD Group, Inc. 
900 West Shore Road 
Port Washington, NY 11050
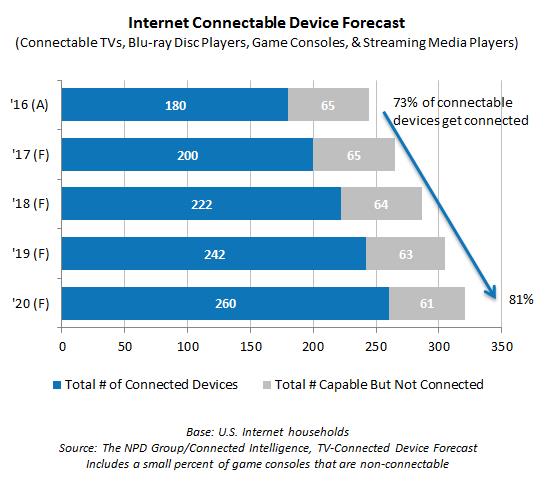
Port Washington, NY, June 28, 2017 – By the end of 2020 there are forecast to be 260 million installed devices attached to the internet and able to deliver apps to TVs, according to the latest NPD Connected Intelligence forecast. This represents 31 percent growth in TV-connected devices over the forecast period, led by smart TVs and streaming media players. In fact, smart TVs will drive nearly half (48 percent) of installed internet-connected TV device growth through 2020, while streaming media players will contribute 31 percent of ownership growth.

The TV-Connected Device Forecast looks to shed light on how new generation smart TVs and evolved streaming media boxes and sticks will shape home entertainment. According to the forecastby 2018, and through the end of the forecast period, household penetration of smart TVs will achieve relative parity with streaming media players as platforms delivering apps to TVs.

“Sales of smart TVs and continued growth in streaming video will contribute to the increase of installed internet-connected TVs,” said John Buffone, executive director, industry analyst, NPD Connected Intelligence. “Additionally, 4K mass market adoption plays an important role, as nearly all 4K TVs are internet capable.”

The rate of attaching connectable-TV devices to the internet is projected to increase from 73 percent in 2016 to 81 percent of installed units by 2020. This will eventually lead consumers to choose a preferred device, and result in diminished use for other devices. From January 2013 through January 2017, usage of installed internet capable TVs to access online content increased from 30 to 55 percent, demonstrating growing consumer interest in streaming video. As such, streaming media player original equipment manufacturers (OEMs), including Google, Roku and Amazon, continue to partner with TV OEMs to integrate their operating systems directly into displays.

“All trends point to smart TVs and streaming media players driving the majority of growth in TV-connected devices. When you compound the increased usage for streaming video, it points to further dominance of these platforms, as they provide the premium content and ease of use consumers demand,” noted Buffone.

Methodology

The NPD Group Connected Intelligence TV-Connected Device Forecast draws data from the quarterly Connected Home Survey and Consumer Technology Tracking Service. The Quarterly Connected Home Survey is based on consumer panel research that reaches over 5,000 U.S. consumers, aged 18+ from diverse regions and demographical backgrounds. They report on more than 12,000 TVs installed within over 34,000 household rooms.


Press Contact

Megan Scott 
516-625-7516  
megan.scott@npd.com

The NPD Group, Inc. 
900 West Shore Road 
 Port Washington, NY 11050
Port Washington, NY, June 13, 2017 – The unlocked mobile phone market has reached approximately 30 million consumers in the U.S, which currently accounts for 12.5 percent of the market, according to global information company, The NPD Group. As the unlocked phone market continues to grow, the latest Unlocked Phone Demand Report 2.0 from NPD Connected Intelligence compares consumers who purchased unlocked phones, to the larger base of consumers who purchased standard, locked phones from their carriers. Among the findings, the report revealed that consumers with unlocked phones are less loyal to both carriers and device brands than those with locked phones.

According to the report, 30 percent of unlocked phone users switched carriers when purchasing a new device, versus 24 percent of locked phone users. In fact, the number one motivator for purchasing an unlocked phone was freedom to choose a future network. Unlocked users were also more likely to cite ‘lowering cost’ as a reason for switching carriers than those with locked devices (45 percent versus 34 percent respectively).

“The market is made up of two distinct consumer bases: price sensitive consumers looking for low-cost devices that deliver value; and high-end, tech focused consumers, looking to differentiate from the standard choices,” said Brad Akyuz, director, industry analyst for NPD’s Connected Intelligence. “Now that smartphone subsidies are nonexistent, for the most part, the unlocked market has become a cost effective option.”

In addition to being more likely to switch carriers, unlocked phone users are also more likely to purchase a different device brand when upgrading. Forty-eight percent of unlocked phone users switched brands when upgrading devices, compared to 37 percent of locked phone users. Among unlocked users brand loyalty increases with price paid.

“Retailers, both in-store and online, have taken this opportunity to increase their unlocked phone selection, as more consumers are open to purchasing alternative brands for a lower price, or even for the same price if the functionality is appealing,” noted Akyuz. “As the unlocked phone market grows, differentiation will be key for original equipment manufacturers. While price is one competitive component, devices will need compelling features/functionality to appeal to consumers and retailers alike.”

Methodology
The results of the NPD Group Connected Intelligence Unlocked Phone Demand Report 2.0 are based on consumer panel research from the Unlocked Smartphone Survey, which reached 1,026 unlocked U.S. smartphone owners. This survey was completed in April 2017. As well as the Broadband Adoption Surveythat reached 4,150 U.S. consumers, aged 18+ from diverse regions and demographical backgrounds.


Press Contact

Megan Scott 
516-625-7516  
megan.scott@npd.com

The NPD Group, Inc. 
900 West Shore Road 
Port Washington, NY 11050

Growth continues to be driven by connected TVs and streaming media players

Port Washington, NY, December 16, 2016 – According to the NPD Connected Intelligence Connected Home Forecast, by the end of 2019, 238 million installed devices are expected to be connected to the Internet and able to deliver apps to TVs, representing 59 percent growth from 2015 to 2019. Connected TVs are projected to drive 45 percent of the growth over the coming four years, while less expensive, content-heavy streaming media players are projected to drive 35 percent growth.

The rate of connecting these devices is projected to increase from 70 percent in 2015 to 80 percent of installed units by the end of 2019, driven primarily by hardware prompting connectivity, an increase in quality app programming from TV networks, and improvements to user interfaces.

 “With an ever-increasing number of connectable devices expected to be connected to the Internet, viewers will have the ability to choose their preferred option instead of using the only device they have attached to their TV,” said John Buffone, executive director, industry analyst, NPD Connected Intelligence. “This shift will inevitably result in diminished usage for some devices.”

Beginning in 2016 and through the remainder of the forecast period (2019) we expect streaming media devices will be found in more homes than any other connected TV device. With multiple options available from industry leaders such as Google, Roku, Amazon and Apple, we expect 43 percent of U.S. Internet homes will own at least one streaming media player by the end of 2019. However, Roku and (Google) Chromecast have expanded beyond streaming media players to take advantage of the growth in connected TV sales as well. As such, a consolidation of operating systems has begun with more than ten TV manufacturers opting to partner with Roku and Chromecast, as opposed to manage their own app eco-system.

“The integration of streaming media player operating systems into TVs points to the beginning of a consolidation of operating systems that app developers will need to focus on in order to reach their audience,” said Buffone.

Methodology 
The NPD Group Connected Intelligence Connected Home Forecast draws data from the quarterly Connected Home Survey and Consumer Technology Tracking Service. The Quarterly Connected Home Survey is based on consumer panel research that reaches over 5,000 U.S. consumers, aged 18+ from diverse regions and demographical backgrounds. They report on more than 10,000 TVs installed within over 30,000 household rooms.

About Connected Intelligence 
Connected Intelligence provides competitive intelligence and insight on the rapidly evolving consumer’s connected environment. The service focuses on the three core components of the connected market: the device, the broadband access that provides the connectivity and the content that drives consumer behavior. These three pillars of the connected ecosystem are analyzed through a comprehensive review of what is available, adopted, and consumed by the customer, as well as reviewing how the market will evolve over time and what the various vendors can do to best position themselves in this evolving market. For more information: http://www.connected-intelligence.com.


Press Contact

Megan Scott 
516-625-7516  
megan.scott@npd.com

The NPD Group, Inc. 
900 West Shore Road 
Port Washington, NY 11050

Unlocked phone sales are more likely to occur online, when compared to locked phone purchases 

Port Washington, NY, December 12, 2016 – According to the new Unlocked Phone Demand Report from NPD Connected Intelligence, the unlocked mobile phone market is growing rapidly with an estimated 28 million consumers owning an unlocked device in the U.S., accounting for 12 percent of the market. Additionally, due to limited options available in-store, half of all unlocked phones (51 percent) are being purchased online – a notable deviation from locked phone purchases which traditionally take place in-store. By comparison, 74 percent of locked phones are purchased in stores/kiosks.

“Since consumers now have to pay full price for their mobile phone, the unlocked market is a cost-effective alternative and helps to address the mid-tier pricing market for consumers that are looking for a relatively high-end smartphone, but at a lower price point than the typical $600 plus price tag,” said Eddie Hold, President, NPD Connected Intelligence.

The unlocked market also provides opportunity for new entrant original equipment manufacturers (OEMs) to penetrate the market without a carrier commitment. While this poses a threat to established OEMs already challenged with protecting market share, awareness levels of emerging OEMs are currently below 10 percentage points.

The market is currently made up of two distinct consumer bases: frugal consumers looking for lower-priced devices that deliver; and high-end, tech focused consumers, looking to differentiate from the standard choices. With more devices available, the unlocked mobile phone market is dominated by Android devices (62 percent), as compared to iOS devices (35 percent). The report reveals that unlocked phone users are more likely to prefer prepaid plans when compared to the overall smartphone market, as well as indicate that they remain within their plans boundaries, indicating price sensitivities.

“While costs are a major factor driving consumers to make the switch to an unlocked device, these consumers still expect their devices to deliver dependable service,” said Hold. “That’s why it’s becoming increasingly important for carriers to educate consumers on possible band/frequency issues when using unlocked devices; otherwise, consumers are likely to blame carrier networks for signal losses that are in reality device driven.”

For more information, or to speak with Eddie Hold, please contact Megan Scott, 516-625-7516 or megan.scott@npd.com.

Methodology 
The results of the NPD Group Connected Intelligence Unlocked Phone Demand Report are based on consumer panel research from the Broadband Adoption Survey that reached 4,100 U.S. consumers, aged 18+ from diverse regions and demographical backgrounds. This survey was fielded in July, 2016.

About Connected Intelligence 
Connected Intelligence provides competitive intelligence and insight on the rapidly evolving consumer’s connected environment. The service focuses on the three core components of the connected market: the device, the broadband access that provides the connectivity and the content that drives consumer behavior. These three pillars of the connected ecosystem are analyzed through a comprehensive review of what is available, adopted, and consumed by the customer, as well as reviewing how the market will evolve over time and what the various vendors can do to best position themselves in this evolving market. For more information: http://www.connected-intelligence.com.


Press Contact

Megan Scott 
516-625-7516  
megan.scott@npd.com

The NPD Group, Inc. 
900 West Shore Road 
Port Washington, NY 11050

Holiday TV sales are expected to contribute to growing consumer demand for 4K video content

Port Washington, NY, November 21, 2016 – With awareness and interest on the rise, this holiday season could mark the shift in the 4K Ultra-High Definition (UHD) TV consumer base from early adopter to mass market audience. According to The NPD Group Connected Intelligence Home Entertainment Report, 2016 has seen steadily growing consumer interest regarding 4K. In fact, 38 percent of those surveyed said they are very, or somewhat, likely to use a 4K TV in the future, an increase of five percentage points since Q1 of this year.

 As the adoption of 4K technology expands, industry leaders are preparing for the impending demand for 4K content – from live TV infrastructure being developed to support the broadcast of sports in 4K, to streaming giants offering an array of 4K content. As of Q3, 87 percent of installed 4K TVs had active internet connections, demonstrating that these consumers are among those most eager to stream content. Streaming media player ownership is also on the rise and recent 4K capable device launches from Amazon, Roku and Google further signal the transition to 4K video resolution.

In Q3 2016, 32 percent of U.S. Internet homes had at least one installed streaming media player, an increase of seven million homes over the past year, fueled by the growing number of streaming TV services. While a limited number of streaming media player owners have used a 4K streamer, findings show growth in awareness, interest and usage, driven by Millennials. Over one-third of consumers are aware of 4K streaming media player availability and this number jumps to 52 percent of Millennials surveyed. Millennials are also the most eager to use these products with 39 percent of respondents stating they have interest in future usage.

“While younger consumers are watching more video on their smartphones, they are also driving consumer interest in 4K streaming on TV, as these behaviors are not mutually exclusive,” said John Buffone, executive director, industry analyst, NPD Connected Intelligence. “As consumers make the shift to 4K capable hardware, content providers will be working to distribute 4K content, and in-home broadband speeds will become an important consideration for viewers to ensure a smooth 4k streaming experience.”

In order to stream 4K content consumers must have the hardware, as well as the appropriate broadband speed. To stream 4K video to TV an Internet connection speed of approximately 25Mbps or higher is recommended. According to the Connected Home Entertainment report, approximately five million U.S. households currently have both the hardware and broadband speed required. However, the average home also has eight connected devices, which can put a strain on the network’s ability to transmit a 4K video stream. Positively, the number of U.S. households with 25Mbps or greater Internet speeds has been increasing throughout 2016.

“Content distributors with an infrastructure prepared to offer 4K UHD video streaming are poised to take advantage of the pending inflection point in the display and TV programming industries, as viewers who stream video will be the first to expect their movies and TV shows delivered in 4K resolution,” said Buffone.

 Methodology 
The results of the NPD Group Connected Intelligence Connected Home Survey are based on consumer panel research that reached 5,364 U.S. consumers, aged 18+ from diverse regions and demographical backgrounds. This survey was fielded from July 28 through August 15, 2016. An open source broadband speed test was embedded into the survey to capture consumer’s actual in-home broadband speeds.

About Connected Intelligence 
Connected Intelligence provides competitive intelligence and insight on the rapidly evolving consumer’s connected environment. The service focuses on the three core components of the connected market: the device, the broadband access that provides the connectivity and the content that drives consumer behavior. These three pillars of the connected ecosystem are analyzed through a comprehensive review of what is available, adopted, and consumed by the customer, as well as reviewing how the market will evolve over time and what the various vendors can do to best position themselves in this evolving market. For more information: http://www.connected-intelligence.com.


Press Contact

Megan Scott 
516-625-7516  
megan.scott@npd.com

The NPD Group, Inc. 
900 West Shore Road 
Port Washington, NY 11050

Shifts in usage behavior across all smartphone users nearly triple the amount of video data consumed monthly per user in Q2 2016 vs. the year prior, according to NPD Connected Intelligence

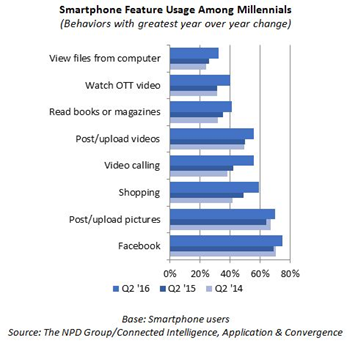
Port Washington, NY, October 4, 2016 – Whether at home or on-the-go, Millennials are leveraging their smartphones increasingly across a number of activities. From Q2 2015 to Q2 2016, the number of Millennials reportedly using their smartphones for video calling has increased 14 points (to 56 percent), for shopping has increased 10 points (to 59 percent), and for video streaming has increased 9 points (to 40 percent), according to The NPD Group Connected Intelligence Application & Convergence Report.

The report analyzes consumer use of smartphones, connected TVs and tablets; examining which content resonates on each device. For Millennials (aged 18 to 34) ownership and usage of computers is declining, as smartphones are leveraged increasingly for Facebook, posting pictures and/or videos, shopping, video calling, reading, streaming video and viewing files from their computer. As Millennials continue to increasingly use their smartphones, especially for activities involving video (video calling, posting and streaming), there is a need for and a migration to larger data plans. 

“Year-over-year we are seeing smartphone usage steadily increase among Millennials, especially as it relates to video features, which are often data-heavy actions,” said John Buffone, executive director, industry analyst, NPD Connected Intelligence. “As next-gen smartphones come to market, video sharing, streaming and calling will continue to grow, and this has spurred new offers from mobile carriers in an effort to grow their consumer base.” 

Video Streaming Drives Data Consumption Among All Smartphone Users 

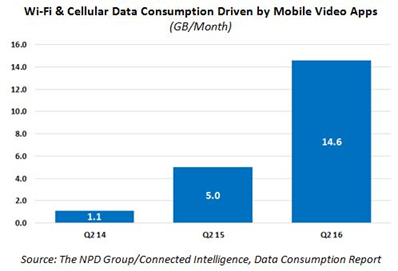
In addition to the increasing data needs of Millennials leveraging smartphones for video calling, posting and streaming, cellular data video consumption is being driven by demand from all smartphone users. According to NPD’s Connected Intelligence Data Consumption Report cellular data video consumption increased 130 percent over the past year (Q2 2015 to Q2 2016). With mobile video consumption on Wi-Fi networks included, the growth rate increases to 192 percent and totals nearly 15GB of data per smartphone user per month, up from 5GB the year prior. While data consumption is already growing, the introduction of zero-rated data plans from mobile carriers will accelerate this trend, as users will be able to stream video content without using their data allowance.

“Mobile carriers are leveraging these plans to appeal to consumers who are often concerned about data overages and to stand out from the competition,” said Brad Akyuz, director, industry analyst, NPD Connected Intelligence. “As mobile carriers continue to promote new offerings that encourage video streaming and with over two-thirds of consumers opting for phones that are ideal for video, with screens 4.7-inch or greater, we expect to see data usage continue to grow.” 

Methodology 
The results of the NPD Group Connected Intelligence Application & Convergence Report are based on consumer panel research that reached 5,110 U.S. consumers, aged 18+ from diverse regions and demographical backgrounds. They reported their usage of desktops/laptops, connected TVs, tablets and smartphones. This survey was fielded from April 26 through May 11, 2016. Trend is compared to the Q2 2015 survey which fielded during a similar period last year. 

The Data Consumption report is based on information collected through the NPD Connected Intelligence SmartMeter. More than 1,500 consumers with Android and iOS smartphone devices opt-in to the SmartMeter panel and are continuously tracked through an app on their devices. 

About Connected Intelligence 
Connected Intelligence provides competitive intelligence and insight on the rapidly evolving consumer’s connected environment. The service focuses on the three core components of the connected market: the device, the broadband access that provides the connectivity and the content that drives consumer behavior. These three pillars of the connected ecosystem are analyzed through a comprehensive review of what is available, adopted, and consumed by the customer, as well as reviewing how the market will evolve over time and what the various vendors can do to best position themselves in this evolving market. For more information: http://www.connected-intelligence.com. 


Press Contact

Megan Scott 
516-625-7516 
megan.scott@npd.com 

The NPD Group, Inc. 
900 West Shore Road 
Port Washington, NY 11050


Network connected cameras account for the majority, 61 percent, of U.S. home automation industry revenues

Port Washington, NY, August 10, 2016 – According to The NPD Group Connected Intelligence Connected Home Automation Report, security and safety top the list of reasons driving consumer interest in building a smarter home. Four-in-ten consumers who are at least somewhat interested in a smart home ranked making their home more secure and safe as the top reason driving their interest. As such, network connected cameras* generated nearly two-thirds, 61 percent, of all U.S. home automation industry revenues in the 12 months ending June 2016**. 

Among the ten percent of U.S. Internet homes that are smart, monitors/cameras are the most common point of entry into the market. According to the report, one-third of smart homes have a networked camera and one-quarter have a security, motion, door or window sensor. While 81 percent of smart camera users leverage the device for its core functionality, home security; over half, 53 percent, of smart camera users cite a utility other than home security. Other uses include monitoring house guests, pets and school-age children.

“Smart cameras generate more retail revenue than any other home automation category, and a growing number of consumers are producing recurring revenue through add-on subscriptions that allow longer tenure video storage and provide features such as the ability to share footage,” said John Buffone, executive director, industry analyst, NPD Connected Intelligence. “As the market takes shape, we expect consumers to flank their smart cameras with other security focused devices such as smart doorbells; in fact, ownership of smart doorbells has grown by 64 percent in the past year.”


* Includes both IP Cameras and CCTV Cameras that come with a network connected DVR 
** Source: The NPD Group / Retail Tracking Service


Methodology

Connected Home Automation Report
More than 5,600 U.S. consumers, ages 18 and older, were surveyed in April 2016.


Press Contact

Megan Scott 
516-625-7516 
megan.scott@npd.com 

The NPD Group, Inc. 
900 West Shore Road 
Port Washington, NY 11050

Seventy-nine percent of activity tracker users exercise on a regular basis, compared to 66 percent of smartwatch users, according to NPD Connected Intelligence

Port Washington, NY, June 13, 2016 – While activity tracker sales continue unabated, the smartwatch is becoming increasingly popular with consumers looking to monitor more advanced activities, according to The NPD Group Connected Intelligence Activity Trackers and Sports Report. The new report looks at wearable technology choices among different exercise groups, and while the activity tracker still leads in the majority of exercise categories, the gap is beginning to narrow. Runners are the first group to show a slightly higher number of smartwatch owners/users, with 22 percent reporting that they run on a regular basis (compared to 21 percent of activity tracker users).

“Activity tracker ownership continues to grow rapidly with more than double the smartwatch base*,” said Eddie Hold, President, Connected Intelligence. “While we are seeing that some forms of exercise are more likely to be impacted by the smartwatch, there are still a number of consumers that are planning to purchase activity trackers to monitor their fitness. Of folks that report they exercise several times a week, 47 percent are planning to purchase an activity tracker soon.” 

As smartwatches move out of the early adopter phase and become more mainstream, the focus on fitness-related activities has grown. When asked how important health/fitness was, 17 percent of smartwatch users considered it a passion, as compared to 13 percent of activity tracker users.

“The activity tracker became the device of choice for the middle-aged consumer looking to get in better shape by starting an exercise routine. But that’s not where the story has to end,” said Hold. “Claims that the smartwatch would lead to the death of the activity tracker have so far proved unfounded. With a longer battery life, activity trackers have a strong target audience and are continuing to evolve. That said, activity tracker companies must continue to broaden their portfolios to satisfy more exercise-focused consumers – combining specialist functions with generalist capabilities.”

As products evolve to include more exercise/sports-focused capabilities, the need for additional smart sensors is on the rise. According to the Activity Trackers and Sports Report, one in four consumers would be interested in purchasing active wear with built-in sensors. However, price is very much a consideration as four in five of those individuals said the price would need to be right (not considerably higher than clothing without sensors) in order to purchase.


*Source: Connected Intelligence Consumers & Wearables; May 2016


Press Contact

Megan Scott 
516-625-7516 
megan.scott@npd.com 

The NPD Group, Inc. 
900 West Shore Road 
Port Washington, NY 11050

Pages