Device Ownership Trends & Profile Report - December 2024
The Device Ownership Trends & Profile report is your go to for understanding what devices consumers own and how that has changed over the past 3-years. The profile tool segments over 300 consumer groups. You can quantify device ownership penetration for your target demographic, shopper, viewer, subscriber and more. The analysis is published every other wave, and the accompanying excel data dashboard provides a more in-depth view of the trends every quarter.
TV & Video Week in Review
Peacock will get its first sports alt-cast
TV & Video Week in Review
The week when:
- PBS and Amazon team up
- Disney+ will add free ESPN content
- Sling TV price hike
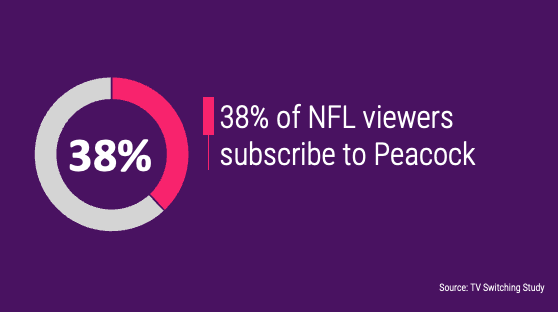
TV Switching Study - November 2024
The TV Switching Study is our semi-annual research on viewers’ TV services, engagement & future intentions. This wave we expanded reporting to cover SVOD bundle offer awareness, subscription, future interest and perceptions, YouTube usage, and the ways viewers would consider watching new release movies at home.
TV & Video Week in Review
The week when:
- Max starting to crackdown on password-sharing
- Disney+ celebrates 5th anniversary
- Amazon is phasing out Freevee
TV & Video Week in Review
The week when:
- Netflix adds new share feature
- Disney+ Top 10 List
- Universal licensing deal with Netflix
TV & Video Week in Review
The week when:
- ESPN and SiriusXM team up
- ESPN DTC service will include ESPN+
- Fubo offers standalone premium subscriptions
TV & Video App Availability Report - October 2024
Availability of TV network, vMVPD, streaming video and sporting apps on devices.
TV Ownership Trends & The TV OS Report - October 2024
The TV Ownership Trends Report quantifies the U.S. TV installed base, room location trends, and delves into what drives consumers to replace their TVs. The dashboards include an 11+ year trend. These data provide a view of how the TV replacement cycle impacts the resulting installed base. The dashboards are updated quarterly.
This wave we added new reporting on the importance of the TV operating system (OS) as well as the specific aspects of it such as ease of use, advertising insertion, and available apps, etc.
Key Findings Include:
TV & Video Week in Review
The week when:
- The Athletic and FuboTV sports partnership
- NBCUniversal streaming local sports on Peacock
- Apple TV+ teams up with MLB